
#33: DGFASLI’s Standard Reference Notes
Another source of data on Indian factories


The Indian manufacturing sector is most commonly described by economists and policymakers using data from yearly reports called the ‘Annual Survey of Industries’, which involves conducting a sample survey and then extrapolating from the results. This survey contains estimates of the number of operational factories, gross value added, net profit, total man-days worked, etc. One advantage of this survey is that it has been available for 60 years (since 1960), making it useful for trend analysis. Justifiably, academic and policy research is dominated by the Annual Survey of Industries (Bollard et al., 2013; Chatterjee & Kanbur, 2015; Majumder, 2010; A. K. Singh & Jyoti, 2020; T. Singh, 2000; Unni et al., 2001). However, the Annual Survey of Industries is not the only source of information about Indian factories.
In addition to the Annual Survey of Industries, data about Indian factories is available from the regulatory filings of Indian factories in each state. This state-wise data is collated by a central agency (Directorate General, Factory Advice Service and Labour Institutes) (DGFASLI) and presented as the Standard Reference Notes– making it a second source of data about Indian factories. Unlike the Annual Survey of Industries, this data is not an estimate but a sum of administrative data collected by the government. The data reported in Standard Reference Notes, and the Annual Survey of Industries have some common variables. However, ~60 new variables are reported in the Standard Reference Notes that are unavailable in the Annual Survey of Industries.
Sadly, researchers will face two challenges when using Standard Reference Notes: timeline and missing data. Unlike the Annual Survey of Industries, data from the Standard Reference Notes is available only from 2006 (17 years as opposed to 60 years for the Annual Survey of Industries). Missing data further hampers this short span of data. This missing data is due to state governments not forwarding data to the Union Government office that releases the Standard Reference Notes.
Despite the drawbacks, attention should be paid to the Standard Reference Notes as it may offer new insights, especially on themes related to occupational safety that are not possible with just the Annual Survey of Industries (Roy & Kshirsagar, 2021; Sharma et al., 2013; Suri & Das, 2016; Vinodkumar & Bhasi, 2009; Yadav, 2019). The data source holds the promise of being much more helpful for academia, policymakers, and industry if the two shortcomings of the data are addressed.
Standard Reference Notes are released annually and contain data on administrative aspects of factories that the Annual Survey of Industries reports do not capture. In total, administrative data can be split into 65 indicators. These indicators can be classified into five categories: the nature of factories and employment, compliance with legal requirements, administrative strength, administrative activities, and occupational outcomes.
The table below shows a sample of indicators that fall under each data category found in Standard Reference Notes.

Table 1 above highlights the difference in the nature of data that Standard Reference Notes provide. Exploring the administrative data may reveal hidden truths about Indian factories that may be difficult to decipher from the Annual Survey of Industries.
Overlap with older data
The two data sources (Annual Survey of Industries reports and the Standard Reference Notes) have some common information, such as the number of factories, the number of workers, and the number of women workers. However, there is a major difference between the Annual Survey of Industries reports and Standard Reference Notes. The data reported in the Annual Survey of Industries is an extrapolation, whereas the data in the Standard Reference Notes are reported as is from administrative filings.
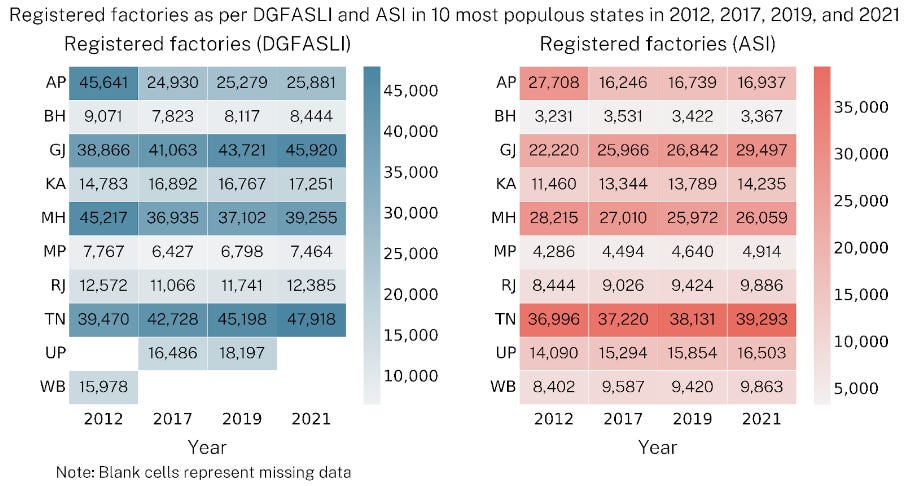
The data on registered and working factories in the Annual Survey of Industries is generally underestimated. Registered factories, as per the Annual Survey of Industries, are underestimated by 22.1% on average. Similarly, working factories, as per the Annual Survey of Industries, are underestimated by 24.8% on average. Figures 1 and 2 below compare the number of registered and working factories as reported in the Annual Survey of Industries and the Standard Reference Notes.

Data on women's employment is also provided in Standard Reference Notes. The data suggests that women's employment is not only low in factories but also shows a wide regional disparity. Figure 3 below shows the distribution of women workers and total workers across states in 2012, 2017, 2019, and 2021.
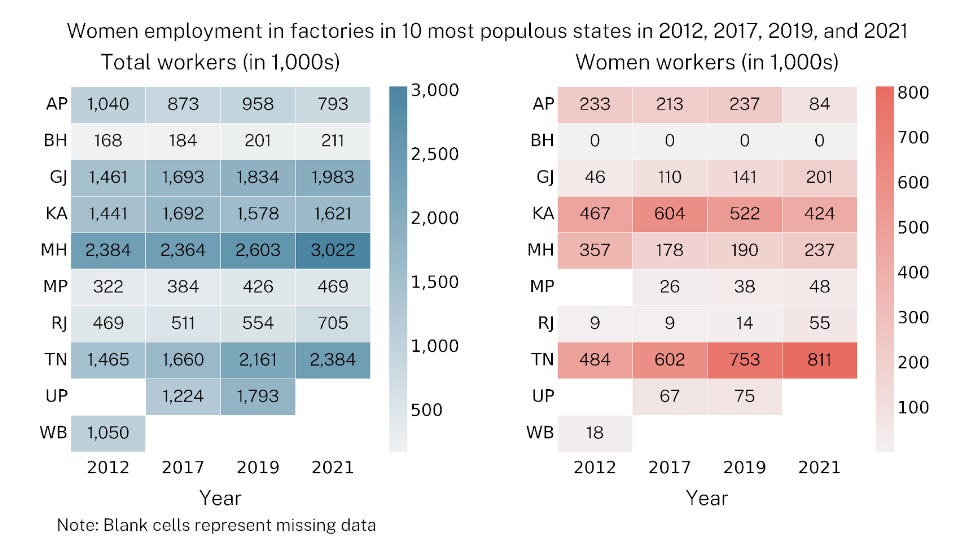
On average, women make up 14% of the total workforce in factories. Only Tamil Nadu and Karnataka are outliers, with women making ~ up 33% of the reporting factory workforce.
The female workers' data in the Standard Reference Notes differs from the Annual Survey of Industries. This is because the Annual Survey of Industries provides numbers for directly employed women workers but does not bifurcate the number of workers contractually employed based on gender. As such, estimating the number of women workers using the Annual Survey of Industries data becomes complex. The complexity is exacerbated because a large percentage of factory workers are contractually employed in India (Chaurey, 2015; J. Singh et al., 2019).
New data in Standard Reference Notes
Apart from the common variables, the Standard Reference Notes contain about 60 new variables that may provide more insights into India's industrial landscape. One example of such data is the number of hazardous factories reported in the Standard Reference Notes but not in the Annual Survey of Industries. Figure 4 below shows the distribution of working and hazardous factories across India's ten most populous states in 2012, 2017, 2019, and 2021.

Only Gujarat and Maharashtra (amongst the top states) have a higher proportion of factories that involve hazardous processes. In Gujarat and Maharashtra, hazardous factories make up approximately 36% and 14% of total working factories, respectively. In most states, on average, hazardous factories make up approximately 8% of working factories.
In addition to the number of hazardous factories, the number of workers in such factories is also published in Standard Reference Notes. Factory work is mostly concentrated in factories where hazardous processes are not undertaken. Figure 5 below shows the distribution of workers in hazardous factories and total working factories across ten states, for the years 2012, 2017, 2019, and 2021.

On average, 21% of the factory workforce works in hazardous processes factories. However, in Maharashtra, the percentage of hazardous factory workers has risen from 14% in 2012 to 33% in 2021.
Factories are required to appoint various officers, provide various welfare amenities, and prepare policies and plans under the Factories Act and Factory Rules. The information about compliance with these processes and appointments is provided in the Standard Reference Notes. Data suggests that many factories comply with the various legal provisions laid down in the law. Figures 6 through 11 show the number of factories complying with various legal requirements.


On average, 90% of the reporting factories comply with the legal provisions laid down in the law.
Standard Reference Notes suffer from non-reporting of data
More information about reporting factories is available in the Standard Reference Notes. However, the data suffers from a drawback– missing points, which are a result of the fact that the report generating authority (DGFASLI) does not collect the data in the Standard Reference Notes. Instead, state governments collect the data and then forward it to the central agency to collate and publish. If the state governments do not forward the data, then the variables are not reported. An example of missing data is the number of inspectors appointed by the state to implement the Factories Act. For the number of inspectors, missing data points range from 12.5% to 67.5%. Figures 12 through 16 below show the status of the strength of administrative personnel and the data points that are unreported for each of them.
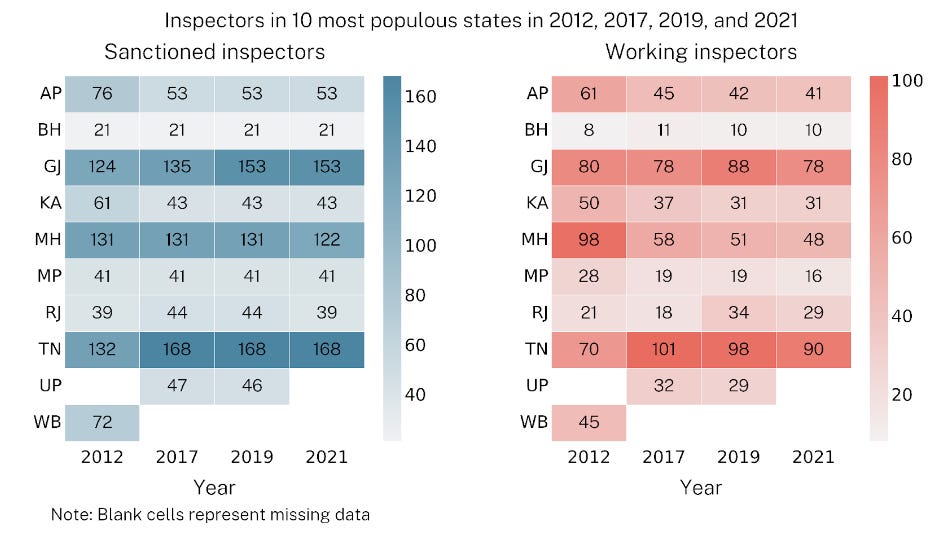
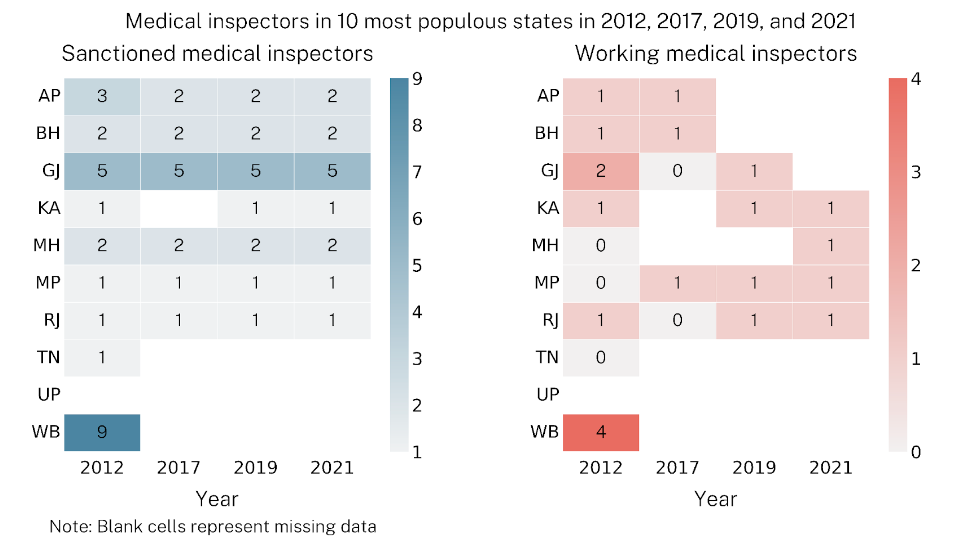


As shown in figures 12 through 16, non-reporting is widespread. This makes deriving meaningful insights on the strength of administrative personnel unrealistic, given that several states have not reported the numbers for multiple years.
The activities of inspectors are also reported in the Standard Reference Notes. This data is better reported than the data on the number of inspectors. Among the ten states, 6.3% (as opposed to 43.8% for appointment of inspectors) of the total data points were missing in the Standard Reference Notes.
In addition to the number of inspectors, the total number of factories (hazardous and normal) is reported in the Standard Reference Notes. Data suggests that the inspectors focus on inspecting factories that carry out hazardous processes within the factory premises. On average, 30% of the total working factories are inspected, while for hazardous factories, the number is 47%. Figures 17 and 18 below show the status of factory inspections carried out in the ten most populous states.


The figures above indicate that inspections are more focused and directed towards factories where hazardous processes are undertaken.
Conclusion
Adding more data sources on any topic is generally positive. This allows researchers and policymakers to triangulate data and address the shortcomings of each data source. If the new data source contains new variables, then new areas of inquiry open up. Standard Reference Notes can be a valuable source of information on the factory sector in India because it does both– report some previously collected data (differently) and introduce the reader to new data points. However, the data source suffers from the drawbacks of missing data and vintage.
Policymakers may benefit if these data drawbacks are addressed. With a complete dataset, policymakers may be better positioned to devise strategies that will improve the quality of work for workers in factories and provide a path to India’s prosperity.
References
Bollard, A., Klenow, P. J., & Sharma, G. (2013). Indiaʼs mysterious manufacturing miracle. Review of Economic Dynamics, 16(1), 59–85.
Chatterjee, U., & Kanbur, R. (2015). Non-compliance with India’s Factories Act: Magnitude and patterns. International Labour Review, 154(3), 393–412.
Chaurey, R. (2015). Labor regulations and contract labor use: Evidence from Indian firms. Journal of Development Economics, 114, 224–232.
Majumder, S. (2010). ASI Database & Firm-level Technical Efficiency: The Case of Indian Chemical Sector. Arthaniti: Journal of Economic Theory and Practice, 9(1–2), 34–59.
Roy, S., & Kshirsagar, R. (2021). Development of risk acceptance criteria in the Indian context. Process Safety and Environmental Protection, 148, 358–369.
Sharma, K., Zodpey, S. P., & Tiwari, R. R. (2013). Need and supply gap in occupational health manpower in India. Toxicology and Industrial Health, 29(6), 483–489.
Singh, A. K., & Jyoti, B. (2020). Factors Affecting Firm’s Annual Turnover in Selected Manufacturing Industries of India: An Empirical Study. Business Perspective Review, 2(3), Article 3.
Singh, J., Das, D. K., Abhishek, K., & Kukreja, P. (2019). Factors influencing the decision to hire contract labour by Indian manufacturing firms. Oxford Development Studies, 47(4), 406–419.
Singh, T. (2000). Total Factor Productivity in the Manufacturing Industries in India. The Indian Economic Journal, 48(2), 108–117.
Suri, S., & Das, R. (2016). Occupational health profile of workers employed in the manufacturing sector of India. The National Medical Journal of India, 29, 277.
Unni, J., Lalitha, N., & Rani, U. (2001). Economic Reforms and Productivity Trends in Indian Manufacturing. Economic and Political Weekly, 36(41), 3914–3922.
Vinodkumar, M. N., & Bhasi, M. (2009). Safety climate factors and its relationship with accidents and personal attributes in the chemical industry. Safety Science, 47(5), 659–667.
Yadav, S. S. (2019). How Safe Are Industries in India? Ascertaining Industrial Injuries in Dadra and Nagar Haveli, India by Capture-Recapture Method. Indian Journal of Occupational and Environmental Medicine, 23(1), 15.
Suyog Dandekar, Shubho Roy, and Abhishek Singh are researchers at Prosperiti.